


New Chronological Periods Distribution Chart
Submitted by david on Tue, 09/22/2015 - 15:27
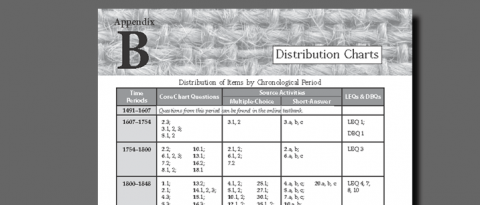
Click here for the chart, or find it in the "Updates" section of the navigation pane.
A new distribution chart has been developed to replace the chart found in Appendix B (p. 114) of the Teacher Edition (also, Appendix B - p. 152 - of the Student Edition). The chart was updated to reflect the latest historical time period designations for the AP U.S. History course. The Distribution Charts are a useful tool for identifying targeted content. Use the charts to gather test and quiz items that focus on a specific time period, learning objective, or historical thinking skill. By gathering content from the book and the test bank, you could easily assemble practice or diagnostics tests to use throughout the year.